EPIC SO2
Volcanic emissions of sulfur dioxide (SO2) and ash have been measured by UV sensors on US and European polar-orbiting satellites since the late 1970s. These observations permit detection of hazardous volcanic clouds in support of aviation safety management; however, they are generally available only once a day from LEO satellites with a delay at least 2-3 hours. More frequent observations can be crucial in providing timely warnings to mitigate threats to aviation safety. Current geostationary thermal infrared imagers including MSG/SEVIRI, GOES-16/ABI and Himawari-8/AHI can detect and image volcanic SO2 and ash plumes, taking advantage of high frequency observations and low latency to provide timely warnings to the public, aviation authorities and airlines. DSCOVR/EPIC provides the first opportunity to observe transient volcanic clouds globally from the L1 Lagrange point. The unique L1 vantage point offers the potential for multiple daily UV observations of drifting volcanic SO2 and ash clouds globally using a single instrument.
The EPIC volcanic SO2 algorithm is a modified version of the heritage Total Ozone Mapping Spectrometer (TOMS) 4-band algorithm, adapted to the EPIC wavelengths. The algorithm uses all four EPIC UV channels (317, 325, 340, 388 nm) to retrieve (i) vertical column amounts of SO2 and (ii) O3, (iii) the Lambertian equivalent reflectivity (LER) at 388 nm, and (iv) its spectral dependence. The algorithm relies on spectral differences in the SO2 and O3 absorption cross sections to simultaneously quantify column amounts of the two gases. SO2 is more absorbing than O3 at the shortest UV channel (317 nm), whereas O3 is more absorbing than SO2 at the longer channel (325 nm). It starts with the climatological value of O3, zero SO2 and flat LER spectral dependence. The algorithm first computes LER at 388 nm, which remains fixed during the iterations, and then iteratively adjusts the initial guess by matching measured and calculated backscattered UV radiances in the shorter-wavelength spectral channels (317, 325 and 340 nm). The sensitivities (Jacobians) associated with linear perturbations in SO2, O3 and LER are numerically interpolated from the backscattered UV radiances look-up tables for the EPIC viewing geometry at each iteration. This algorithm appears to have adequate sensitivity to detect moderate to large volcanic eruptions from L1 at solar and view zenith angles less than ~70o (e.g., Fig. A1).
To increase sensitivity to small eruptions, a simplified version of the SO2 algorithm has also been developed. It uses the 317 and 388 nm EPIC channels and an a-priori estimate of total ozone. The measured in step one ozone field is re-gridded and smoothed, which reduces channel-to-channel co-location errors. The radiances are also smoothed accounting for smooth ozone variations, but excluding pixels with elevated SO2. This error mitigation results in enhanced sensitivity to small volcanic SO2 clouds.
No large tropical eruptions have occurred during the DSCOVR/EPIC mission to date (as of February 2018). However, the sensitivity of EPIC UV radiances to volcanic clouds has been demonstrated by the detection of several mid- to high-latitude eruptions in 2015-2017. Figure A1 shows EPIC SO2 retrievals for the high-latitude eruption of Pavlof (Alaska, USA) in March 2016. Comparison with the low-Earth orbiting Suomi NPP- hyperspectral Ozone Mapping & Profiler Suite (OMPS) SO2 data (Fig. A1c) collected at a similar time shows that EPIC clearly detects the proximal volcanic plume where SO2 columns were highest (>10 Dobson Units: 1DU = 2.69x10¹⁶ molecules SO2 cm,-2), along with some of the distal plume. Note, that the EPIC viewing conditions were not ideal for this eruption, with a relatively high solar zenith angle in Alaska in March, but nevertheless the SO2 cloud was detected in at least 2 EPIC exposures over approximately a 2-hour period on March 28-29 (Fig. A1 a,b), with the first observation ~90 minutes prior to the SNPP-OMPS overpass. The atmospheric infrared sounder (AIRS) on NASA Aqua satellite also detected the Pavlof SO2 emissions and a coincident AIRS retrieval on ~23:30 UTC on March 28, using the method of Prata and Bernardo (2007), is shown in Fig. A1d. The total SO2 mass of 33 kilotons (kT) measured by AIRS compares favorably with the EPIC retrievals, which detected ~25 kT of SO2.
These EPIC exposures provide unique observations of SO2 cloud transport and have great potential to provide new insight into the evolution of volcanic SO2 emissions, as well as more timely detection and tracking of potentially hazardous volcanic clouds. Forecasting the dispersion of volcanic clouds requires an estimate of the volcanic cloud altitude. The combination of total column SO2 observations from polar orbiting satellites with trajectory analysis methods has proved useful for estimating volcanic cloud altitudes. Such techniques would be improved by assimilating more frequent observations of volcanic SO2 from EPIC, enabling more rapid estimation of volcanic cloud altitude.
The EPIC Sulfur Dioxide products are available at the Atmospheric Science Data Center (ASDC) at NASA Langley Research Center: https://eosweb.larc.nasa.gov/project/dscovr/dscovr_epic_l2_so2_01.
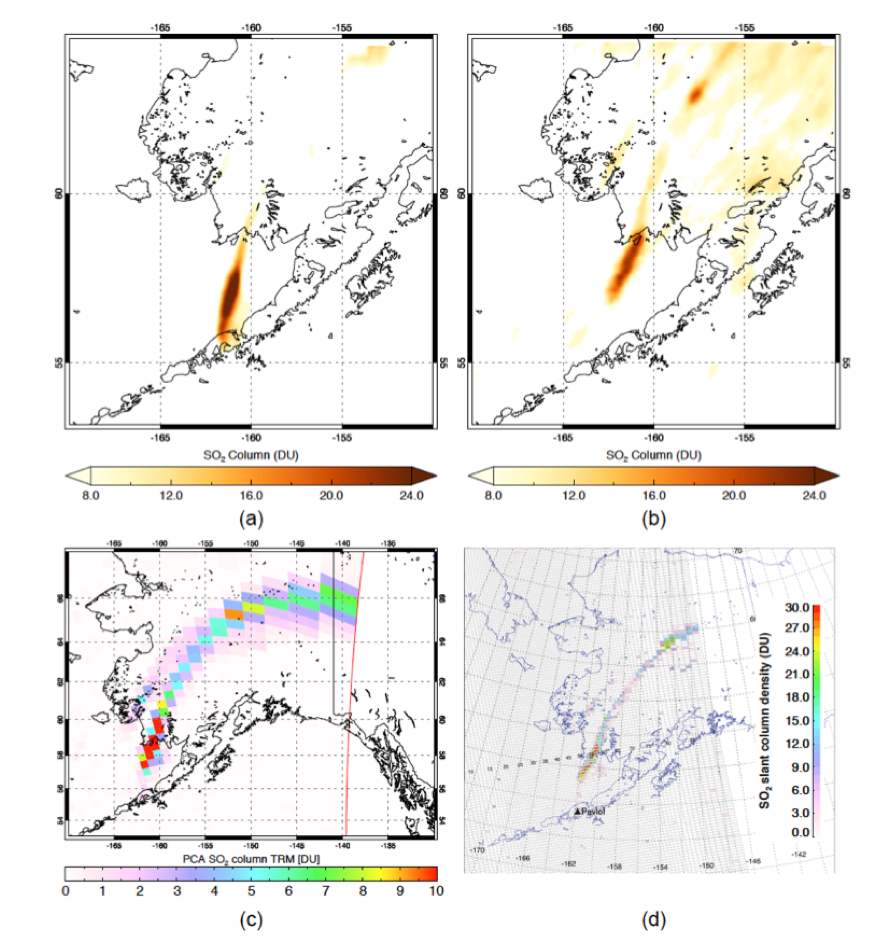
Figure A1. Satellite SO2 maps for the March 2016 eruption of Pavlof volcano (AK, USA; triangle). SO2 in the Pavlof volcanic ash cloud was detected in two EPIC exposures at (a) 21:54 UTC on March 28 and (b) 00:08 UTC on March 29; (c) Suomi-NPP/OMPS SO2 measurements at ~23:25 UTC on March 28 produced using a Principal Component Analysis (PCA) SO2 algorithm assuming a mid-tropospheric (TRM) volcanic plume located at 5-10 km altitude (Li et al., 2017); (d) Aqua/AIRS SO2 measurements at ~23:29-23:35 UTC on March 28.
Figure A2.This animation shows EPIC hourly SO2 maps measured on June 17, 2018, from the June 16 volcanic eruption on Fernandina island in the Galapagos archipelago (Ecuador; triangle). For the first time, SO2 was detected in seven hourly EPIC exposures at 14:47; 15:53; 16:58; 18:03; 19:09; 20:14; and 21:20 UTC. EPIC hourly SO2 measurements clearly show fast counterclockwise volcanic plume dispersion with prevailing tropospheric winds. Such point-source SO2 dispersion patterns can be used to validate aerosol- and chemistry-transport models in remote locations. The SO2 measurements are not currently available from geostationary satellites.
Publications:
Li, C., Krotkov, N. A., Carn, S., Zhang, Y., Spurr, R. J. D., and Joiner, J.: New-generation NASA Aura Ozone Monitoring Instrument (OMI) volcanic SO2 dataset: Algorithm description, initial results, and continuation with the Suomi-NPP Ozone Mapping and Profiler Suite (OMPS), Atmos. Meas. Tech., 10, 445-458, doi:10.5194/amt-10-445-2017, 2017.
Prata, A.J., Bernardo, C., 2007. Retrieval of volcanic SO2 column abundance from atmospheric infrared sounder data. J. Geophys. Res. 112, D20204. http://dx.doi.org/10.1029/2006JD007955.